
기록
xml 파일 데이터를 활용하여 Image에 box 그리기 본문
import os
import sys
import xml.etree.ElementTree as Et
from xml.etree.ElementTree import Element, ElementTree
import matplotlib.pyplot as plt

from PIL import Image
from PIL import ImageFont
from PIL import ImageDraw

#경로
path = 'E:\Dataset\VOC2012\VOC_train\VOC2012'

#경로 합칠 파일명 ('JPEGImages', 'Annotations')
IMAGE_FOLDER = 'JPEGImages'
ANNOTATIONS_FOLDER = 'Annotations'

#os.walk 이용하여 Annotations 폴더의 경로, 폴더 리스트, 파일 리스트 정보를 담은 iterator 반환
ann_root, ann_dir, ann_files = next(os.walk(os.path.join(path, ANNOTATIONS_FOLDER)))
img_root, img_dir, img_files = next(os.walk(os.path.join(path, IMAGE_FOLDER)))

#반환되는 경로, 폴더 리스트, 파일 리스트 출력
#print("ROOT : {}\n".format(ann_root))
#print("DIR : {}\n".format(ann_dir))
#print("FILES : {}\n".format(ann_files))

for xml_file in ann_files:

    #XML파일과 이미지 파일의 이름은 같기에 확장자를 맞추어 찾는다.
    #기존 xml파일의 xml확장자를 jpg로 바꾸는 과정
    img_name = img_files[img_files.index(".".join([xml_file.split(".")[0], "jpg"]))]

    #최종 이미지 파일의 경로
    img_file = os.path.join(img_root, img_name)

    #이미지 열기
    image = Image.open(img_file).convert("RGB")
    draw = ImageDraw.Draw(image)


    #xml 파일 open
    xml = open(os.path.join(ann_root, xml_file), "r")
    #파싱하기
    tree = Et.parse(xml)
    #루트 가져오기
    root = tree.getroot()

    size = root.find('size')

    width = size.find('width').text
    height = size.find('height').text
    channels = size.find('depth').text

    #print("Image properties\nwidth : {}\nheight : {}\nchannels : {}\n".format(width, height, channels))

    objects = root.findall("object")
    print("Objects Description")

    for _object in objects:
        name = _object.find("name").text
        bndbox = _object.find("bndbox")
        xmin = int(bndbox.find('xmin').text)
        ymin = int(bndbox.find('ymin').text)
        xmax = int(bndbox.find('xmax').text)
        ymax = int(bndbox.find('ymax').text)

        print('class : {}\nxmin : {}\nymin : {}\nxmax : {}\nymax : {}\n'.format(name, xmin, ymin, xmax, ymax))
        #Box를 그릴 때, 왼쪽 상단 점과, 오른쪽 하단 점의 좌표를 입력으로 사용
        draw.rectangle(((xmin, ymin), (xmax, ymax)), outline="red")
        draw.text((xmin, ymin), name)

    plt.figure(figsize=(25,20))
    plt.imshow(image)
    plt.show()
    plt.close()
    print("XML parsing END")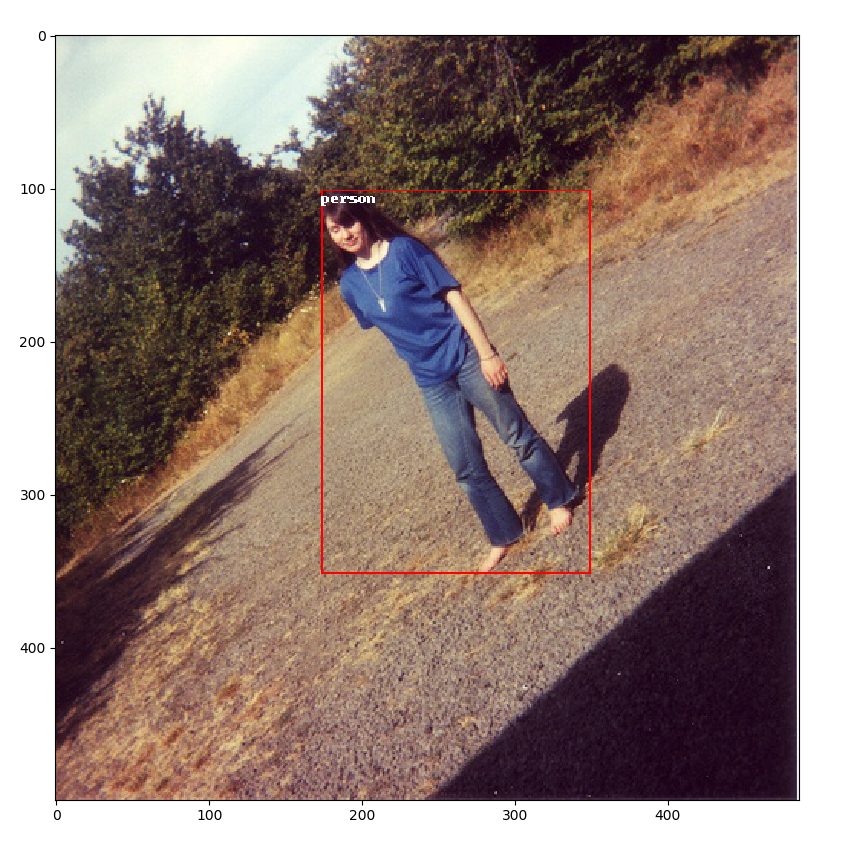

'딥러닝' 카테고리의 다른 글
| 딥러닝(deep learning) 용어 - 파라미터와 하이퍼파라미터 (0) | 2021.07.21 |
|---|---|
| 데이터 라벨링 (0) | 2021.06.19 |
| 파이썬으로 xml 파일 로드하기 (0) | 2021.06.16 |
| Image load & show (영상 시각화) (0) | 2021.06.15 |
| pix2pix (0) | 2021.05.11 |
'딥러닝' Related Articles
more


Comments